Start here
Dashboard
1 min read
The Dashboard is your workspace at a glance for the selected environment:
- Counts: workflows (and how many are active), all-time runs, connections, users, adapters.
- Run health over the last 7 days.
- In flight: runs Queued, Waiting, Running and recently Failed, including canvas tests, plus how many runs are waiting to start across the workspace against its limit.
- Needs attention: failures and stuck items to look at.
- Recent workflows, Activity and Usage This Month. Only completed runs count toward your plan; failed runs never do.
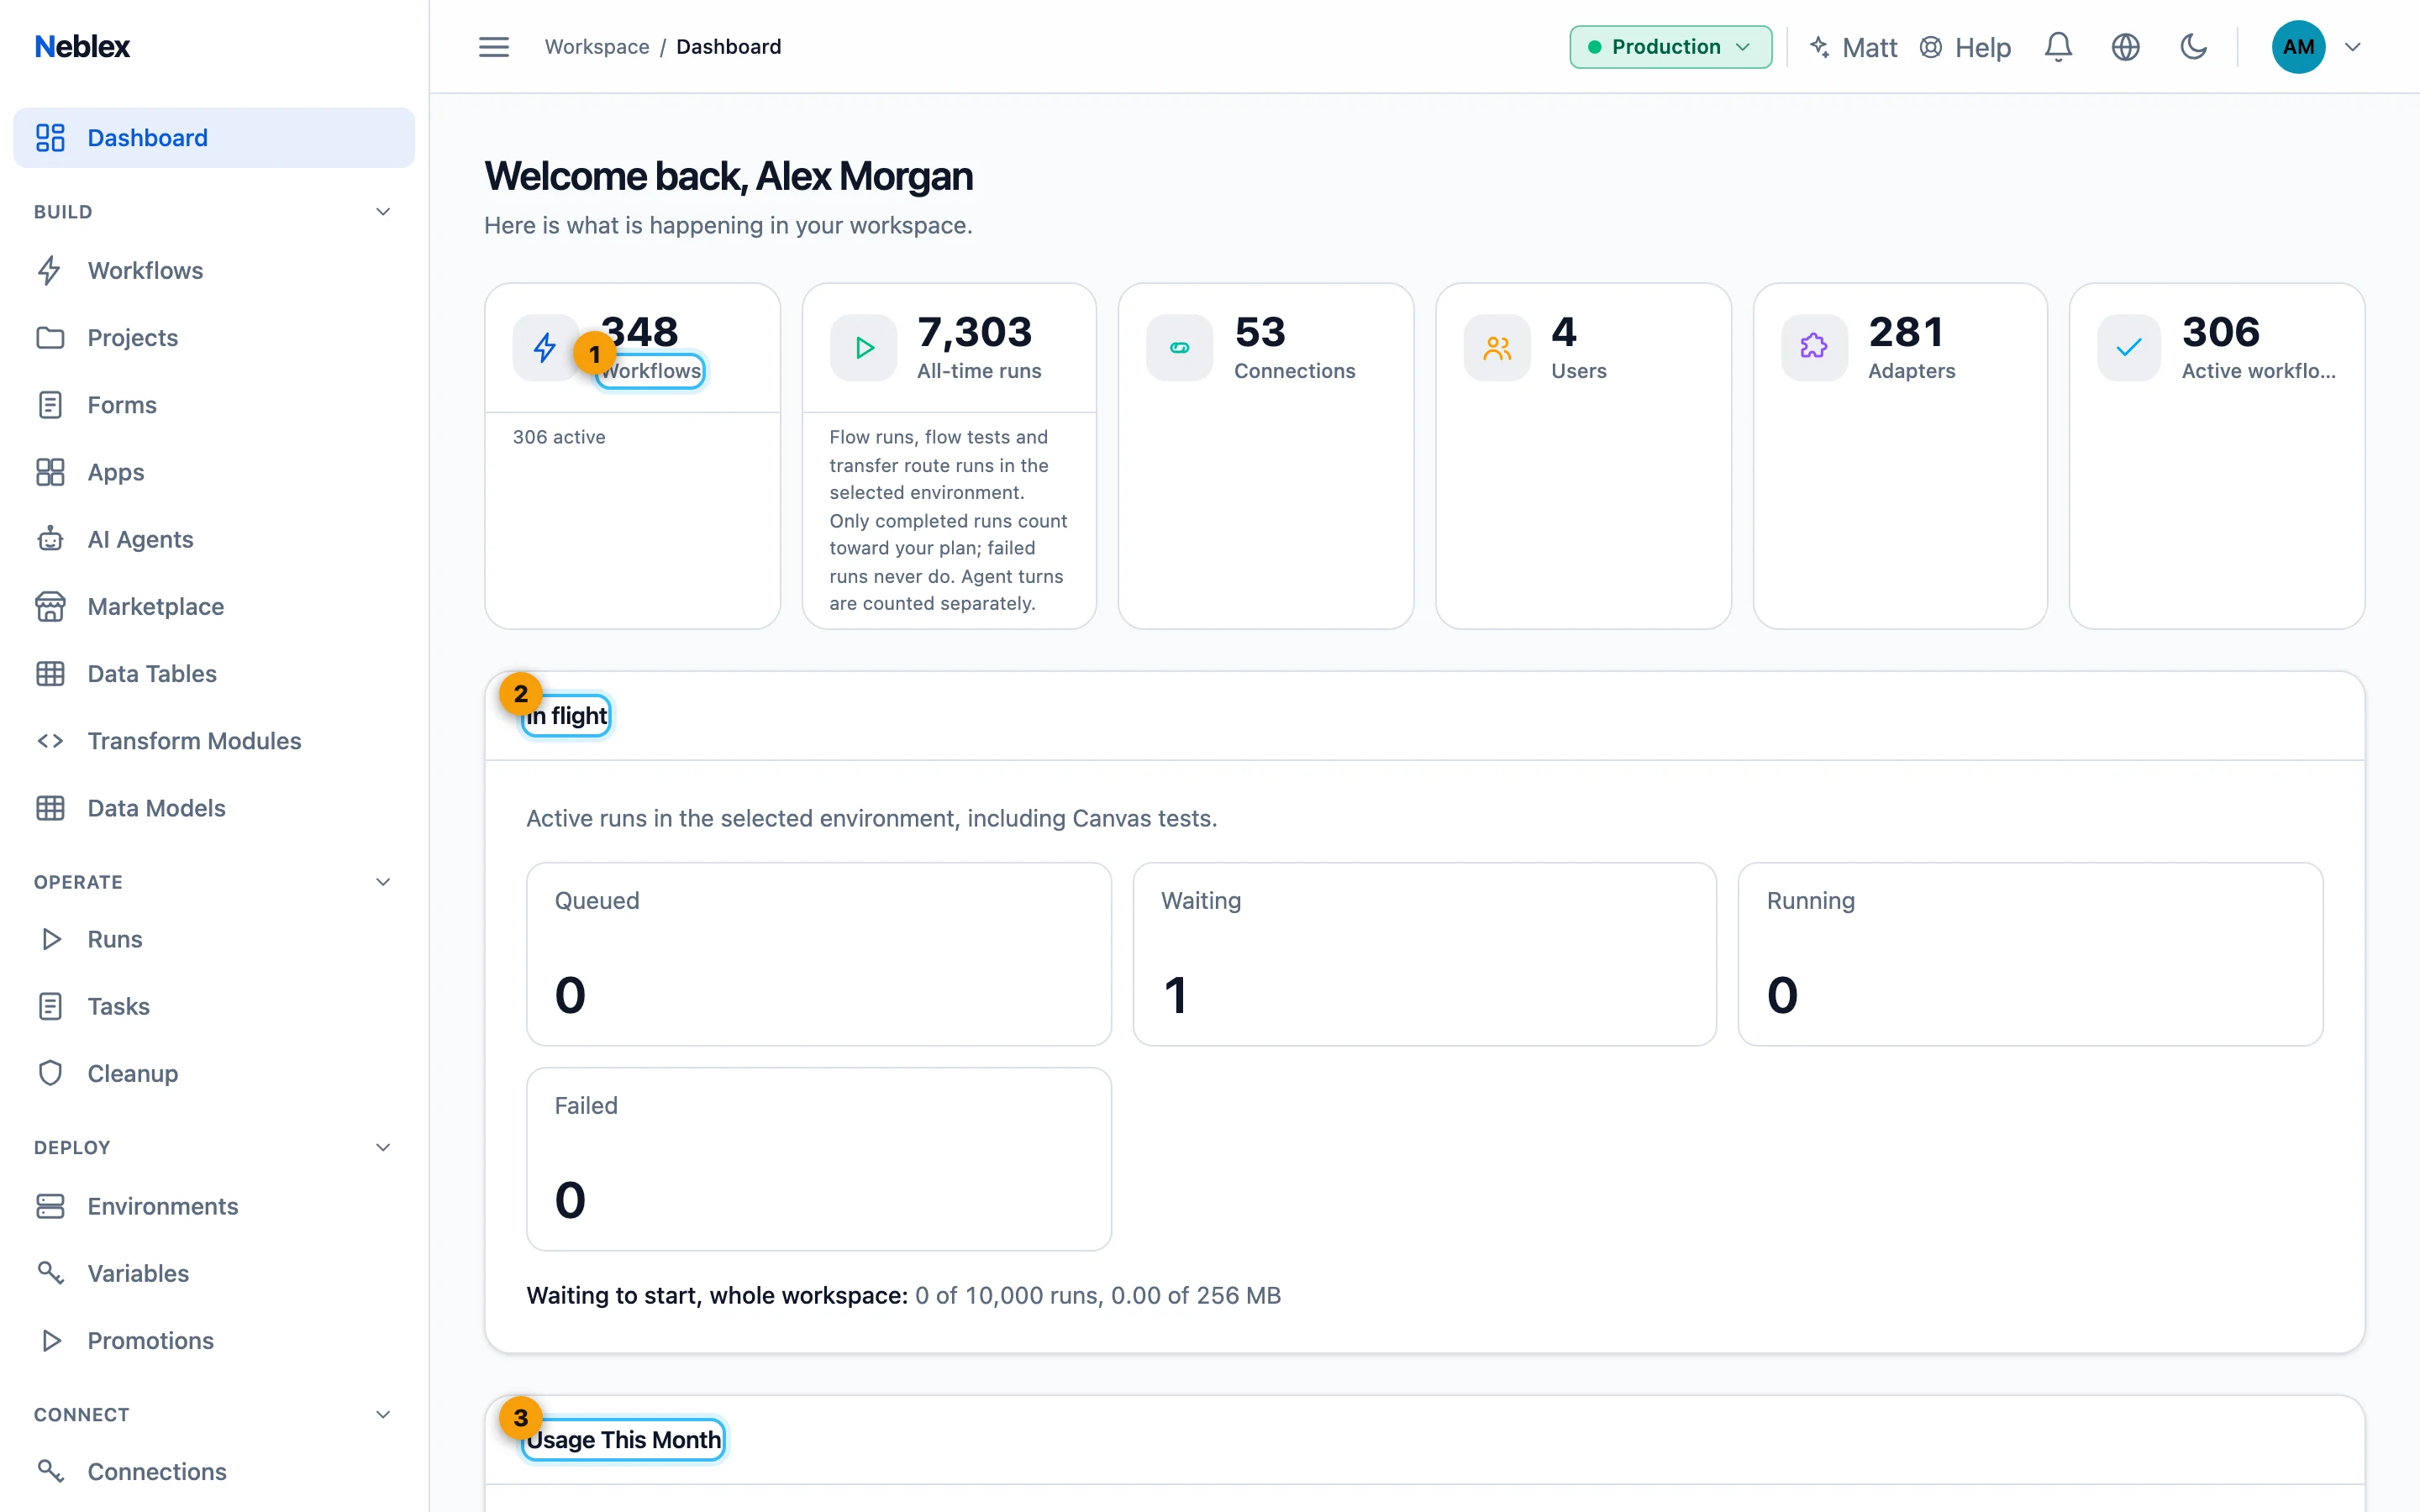
- Workspace counts at a glance.
- Runs queued, waiting, running and failed right now.
- Completed runs against your plan.